Visualization Of Dependent Test Methods
One day I started to experiment with visualization of test dependencies. I thought that maybe Graphviz can help to provide some nice diagrams that would help me see instantly what went wrong, and why some tests are skipped. In this post I present my achievements so far.
You will find much more about testing in my book
"Practical Unit Testing
with TestNG and Mockito"

Dependencies Between Test Methods
TestNG allows you to set dependencies between test methods, e.g. you can say that test method B should be execute only if test method A passed. In other case, test B will be skipped (see Testing Basics: Results Of Tests if you are not familiar with "pass" and "skip" terms).
You can also make a test method or class depend on a whole group of tests. For example you can say that tests from "slow" group (which gathers all heavyweight, long running tests) should be executed only if all tests from "smoke" group were green.
Visualization
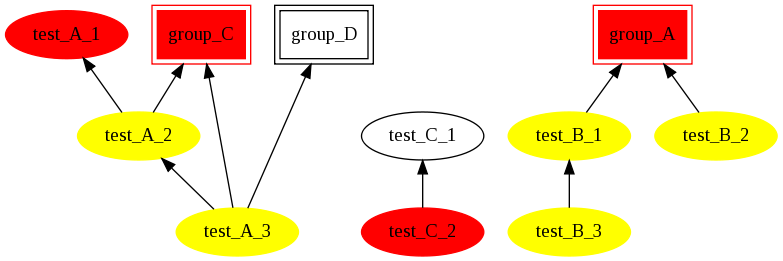
I created few bogus tests to present you what kind of visualization is possible. There are many dependencies between test methods, so the resulting diagram looks like this.

There are two types of entities presented there:
- groups (rectangles),
- test methods (ovals).
Failed tests are marked with red, skipped with yellow. Tests and groups that passed are not coloured (e.g. test_c_1 and group_d). Group is marked with red, if any test method of this group failed.
From the diagram you can learn:
- who depends on whom, e.g. test_c_2 on test_c1, test_a_2 on test_a_1 and group_c,
- why a test was skipped, e.g. test_a_2 was skipped, because it depends on test_a_1 (which failed) and group_c (which also did not suceed)
Further Improvements
Surely the diagrams might be nicer and more informative.
First of all, it would be nice to generate diagram without running tests. Why wait for few seconds if you are only interested in visualization of dependencies between tests? I'm not sure how to do it, but TestNG seems to be flexible enough that I can make it to "run the tests but skip them all" or something like that.
Secondly, I need to run this on some bigger (test-)code base to see how the diagram looks like and it will hopefully give me some hints on possible improvements.
Thirdly, it would be nice to know why a group is marked red, i.e. what test methods of this group failed.
Also, I guess the layout of groups and methods could be improved. Right now all groups are drawn on the same level. Not sure if this is the right approach. Not even sure if there is any "right approach" that will suit us all. The source code is available at github. Enjoy !
Fork Me, Baby!
You are encouraged to fork me on github and do some coding! (Watch out, the code needs some cleaning, and I don't have time to do it, sorry...)
Links
This used to be my blog. I moved to http://tomek.kaczanowscy.pl long time ago.


Unittest combination is good too
I would like to use Unittest-Combination to do this kind of test too, with unittest, you can make sure each independent part works well, then with combination test, you can make sure then work well cooperate with each other. Calories in a Banana